

We offer specialized consulting services for applying QC tools designed to help organizations in problem solving. Our consulting support your journey towards continuous improvement through problem solving and sustainable, safe and compliant work environment.
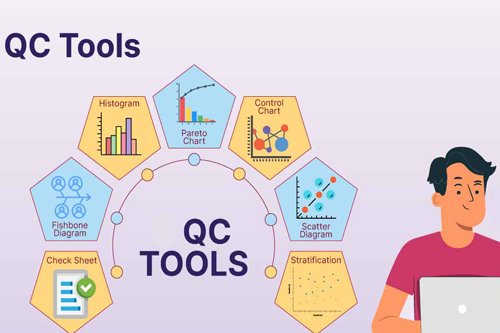
The QC (Quality Control) Tools are fundamental techniques used in problem-solving, root cause analysis and process improvement in manufacturing and service industries. These tools help in identifying, analyzing and eliminating quality issues to ensure consistent product and process excellence.

Pareto Analysis, also known as the 80/20 Rule, is a powerful decision-making tool that helps businesses focus on the most significant

The Fishbone Diagram, also known as the Ishikawa Diagram or Cause-and-Effect Diagram, is a visual tool used to identify

FMEA (Failure Modes and Effects Analysis) is a structured methodology used to identify, evaluate, and mitigate potential failures

The 8D (Eight Disciplines) Problem-Solving Methodology is a structured, team-based approach used in Quality Control (QC) to identify

A Control Chart is a statistical tool used to monitor, control, and improve process performance over..

A Flow Chart is a visual representation of a process, showing the sequence of steps involved from start to finish.